At CASE, our software engineers sit alongside architects. This allows us to create great software for the AECO industry, but it also allows us to see old problems from a new perspective. A few years ago, we realized that the way our software engineers track bugs in their software is pretty much analogous to how we were tracking issues in building information models. Except our software engineers were using far more sophisticated methods to resolve these issues than our architects.
Software bug = AECO issue
A bug is a uninvited behavior of an application. When software engineers find bugs, they typically collect basic information about the bug. This information varies depending on what the bug is, but typically the information will be its location, explanation of how to replicate it, who is assigned to work on it, and its status. The status is typically driven by a prescribed workflow that advances the ‘bug’ through a series of development stages, code reviews, testing stages, and finally towards a version release. When the bug is fixed, the resolution, if any, is documented.
In the AECO industry, issues are discovered during the design, construction, and operation of a building. These issues may be design related involving the specification of a product, approval of a layout, or the lack of accessibility. It may be a coordination issue relating to the installation or performance of real-world building systems. In other words, the definition of an issue in the AECO industry is much larger than a clash found during a clash detection analysis. We define an issue as an identified moment that requires decisive action, or the identification of a need for action, for a project to proceed.
Comparing the definition of a bug to that of an issue, they are the same thing. The difference is not in the definition, but in the life-cycle. Issues in the AECO industry are rarely tracked through different stages towards a documented resolution. This is explained further in this post.
Software for bug/issue tracking
Bug tracking technology has come a long way, even in the 4 years of CASE using it. However, the fundamental process and integrations built around this process is exactly what the building industry is missing in the standard design and construction coordination process. Instead, all of the industry experts are relying on our authoring and analysis software to do it for them. Using Revit, Navisworks, and Solibri to manage our issues is like a developer using Visual Studio to manage their bugs. Simply put, it is the wrong place for that information to be managed. For an explanation of why, check out this post.
There are many software industry specific tools on the market that provide issue tracking capabilities. One that stands above the rest for its product integrations and for its easy to use front-end design is Atlassian Jira. Jira has an API that is well documented and built in integrations to other tools like Bitbucket and Hipchat. It is also built to allow for a massive amount of customization. Once we selected Jira as our weapon and learned the lingo of the software industry, we customized the product to align with the building industry. This included defining our own issue type schema, issue properties, and a series of workflows an issue can go through depending on the issue type and project type.
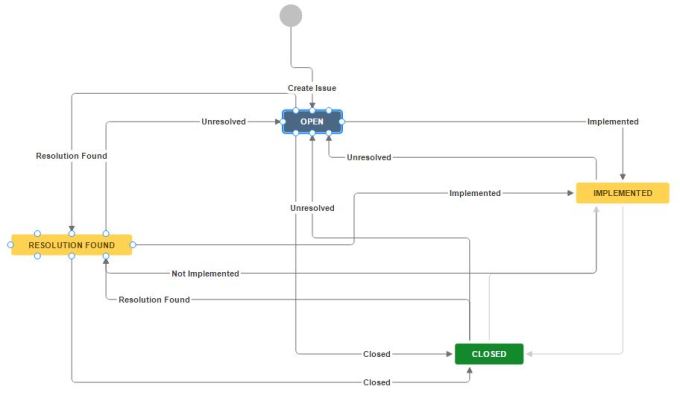
Customized Jira workflow for issues found in the AECO industry
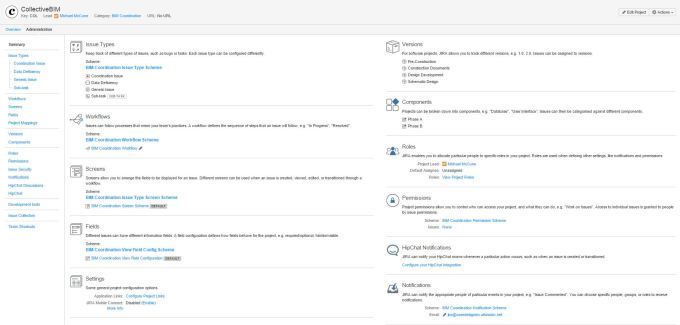
Customized Jira project settings for AECO projects
Analysis to issue tracking workflow
Issues are capable of being generating in many places, like Revit, Navisworks, Tecka BIM Sight, Solibri Model Checker, and of course directly within Jira. It is often the case that issues start from various applications. Recently, we have helped our clients abandon their antiquated coordination methods by deploying a customized instance of Jira that aligns with their needs, and developing the tools necessary to support them. We have built a number of integrations with Jira, but let’s look at the Solibri -> Jira rountriping workflow we use when we run analyses in Solibri.
As an example, a model within Revit may not be abiding by the requirements set forth in the BIM Execution Plan. If so, an issue can be fashioned within Revit that also captures the view. In the image below, I create an issue within Solibri Model Checker after running a simple model intersection check. The key piece here is to avoid creating the issue the way Solibri anticipates you to, within the results panel. Instead, create the issue within the Presentation panel. The results panel limits you to Solibri’s issue resolution workflow, with its copious glitches, constraints, and generally bad interface. This reason was described clearly in this previous post that emphasized the AEC’s incompetence of how to manage issues in the building industry.
Documenting issues, with multiple viewpoints, found in Solibri within the Presentation window
Once the issue is created, comments created, and camera perspective is marked up, we simply report out all the issues as a BCF. BCF is used as the transmission format, as described in this article. Most of the issue’s data we care about within Solibri is supported by BCF, but if we desire multiple images/camera perspectives to describe an issue or additional data not supported by BCF, we have to take an superfluous step. The only way Solibri allows us to get this information out is to also export an Excel report using a customized template; however, in the case of an additional image this export format only permits us to capture the image/snapshot and not the actual camera location. Let’s hope Solibri will open up their API soon so that users are not restrained to reports and templates.
Exporting issues found in Solibri to Jira via BCF, Excel, and CASE’s Issue Tracker
Next we launch the CASE Issue Tracker, which connects to our customized cloud-based instance of Jira. Within the application, we select the project that we would like to push new issues to. Then, by dragging the BCF file onto the application, it switches to a BCF tab to preview the BCF we just dropped in. If we had exported an Excel file to capture any issues with two or more images, the application recognizes the excel file and pairs it with the BCF. From there we can delete any issues and select the issues we want to upload to Jira. Doing so brings up a Batch Upload screen, which allows us to select several issues and add values to fields that exist in Jira, assign issues to users, select what type of issue an issue should be, all in one batch push. One thing to highlight is that all of these available fields, users, and issues types are all associated with the Jira project we have chosen to upload to. These can vary for every project.
Posting issues to Jira via BCF, Excel, RestAPI, and CASE’s Issue Tracker
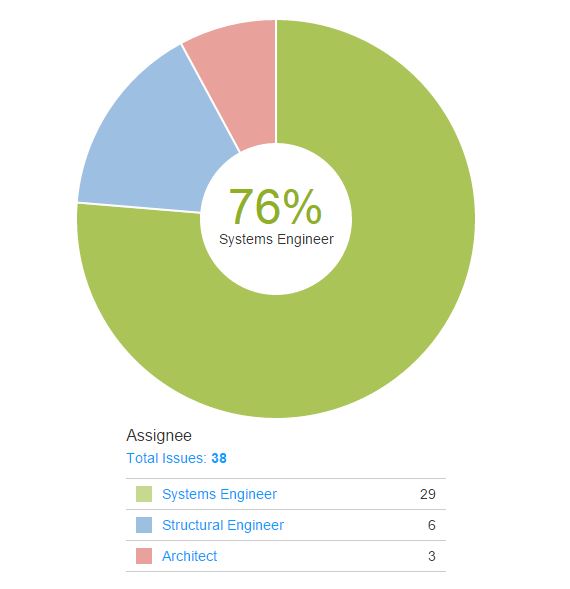
Once we have uploaded the issues to Jira, the dashboards are automatically updated, and the team is notified that new issues have been uploaded. Team members then use Jira to conduct a preliminary review of the issues by adding comments to each issue. They often instantly begin to resolve issues before the meeting. By clicking on their portion of the issues by assignee pie chart, they can view all the issues they are assigned to and can transition the issues from an open status to an implemented status. This communicates to the team that action has been taken to resolve the issue in the model. For any issue no capable of being resolved without input from another team member, an issue’s priority can be raised or flagged to make sure the issue is discussed in the coordination meeting. When the coordination meeting occurs, Jira and Solibri are used to lead the meeting. All actions for resolution are documented in Jira, providing the project team and stakeholders an audit trail.
Review issues, commenting, and changing their status inside Jira
After the meeting, all the issues of the project are downloaded from Jira as a BCF. Inside of Solibri, the presentation is then updated to reflect the latest BCF downloaded from Jira. This updates all fields, statues, assignees, and adds any new comments that occurred on Jira that are not captured in Solibri.
Syncing issues between Jira and Solibri
When the project models are uploaded again, this process then starts all over, starting with the issues already created to check if they have been resolved. As the geometry and GUIDs of that geometry live and die, the issues stay living until they are resolved by the reviewer, not the software. In other words, we do not lose an issue or have an issue transition to being resolved, simply by the model author deleting the element in question.
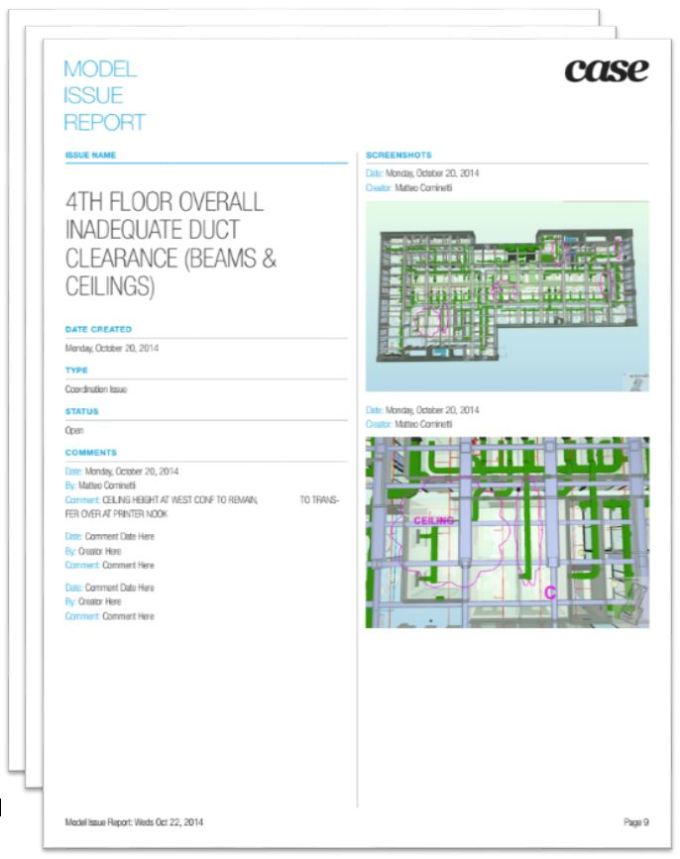
Periodically and at each major milestone, a fully customizable PDF report can be generated directly from the Issue Tracker. This tangible PDF report becomes a historical record that can be filed and doodled on, not as the single source of truth. For that, we rely on Jira.
Example report generated from CASE’s Issue Tracker that captures information from Jira & Solibri
A project’s single source of truth
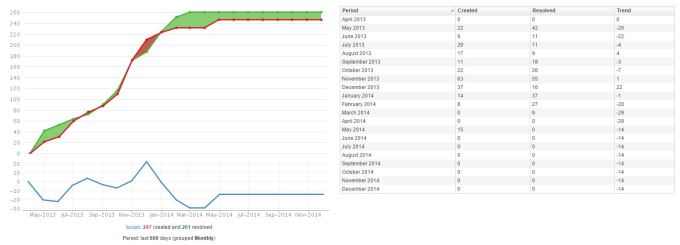
With Jira being a cloud-hosted technology, the project dashboards are accessible from anywhere, giving the team a vision of the project like never before (see image below). In one view, the team can gain an understanding of the project status, activity, and trends. It also democratizes access to this type of information by allowing nontechnical users like clients and project directors to see the higher level metrics without needing the technical skills or software to dig through hundreds of individual issues.
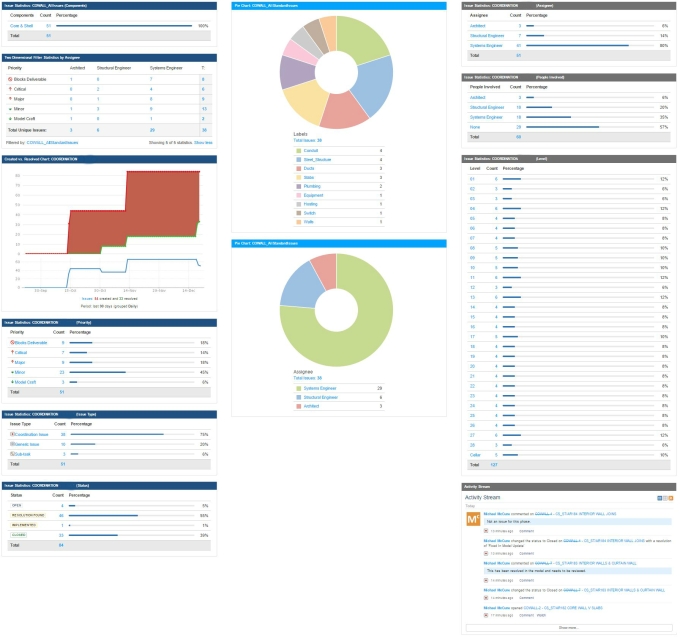
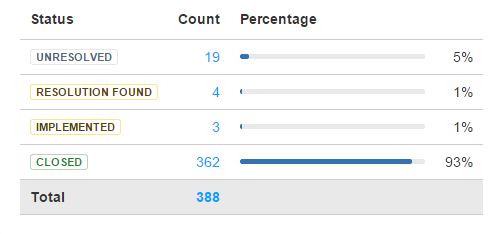
For example, a client can look at the following two charts and see that the team is not making progress on resolving coordination issues. Not only can they see how many are still unresolved, but by looking at the Issue Created vs Issue Resolved chart, they can see that there has been a few months of no activity.
If it has been a while since the last time they logged into the project, they can scroll through the activity stream to see what has happened in their absence, again without getting bogged down into the details. Project managers and team members also use the dashboard in order to dive into the issues they care to look at. Different charts showing custom slices of the data allow a user to dive directly into a filtered list of issues that meet a certain criteria. For example, an engineer may want to only look at issues they are either assigned to or involved in.

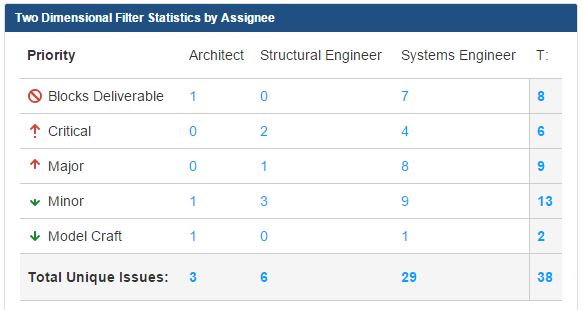
An engineer may also be interested in seeing all the issues of a certain high priority so that their efforts are focused.
Once the user clicks on any of the charts, they are directed to a page displaying a filtered list of issues meeting that chart’s criteria. As they click on each issue within the list, they are presented with all the details of that issue. Each issue is capable of having any number of properties associated with it, which in turn can be used to create charts. Issues can contain any attachments including images, camera views, specifications, models, and drawings. If a user wants to share a list of issues or a single issue, they can send the URL or send an email from the Jira interface.
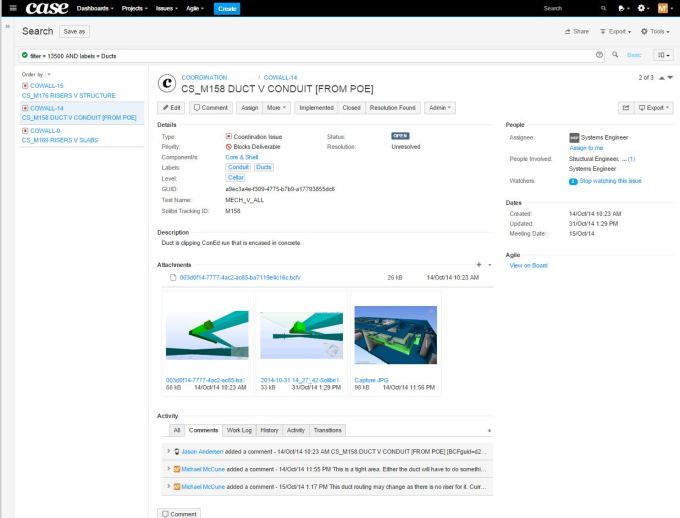
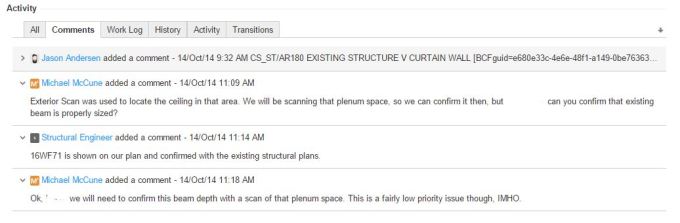
As users communicate about an issue, all of the conversations are captured on the issue’s page.
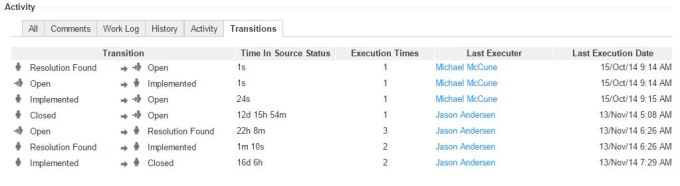
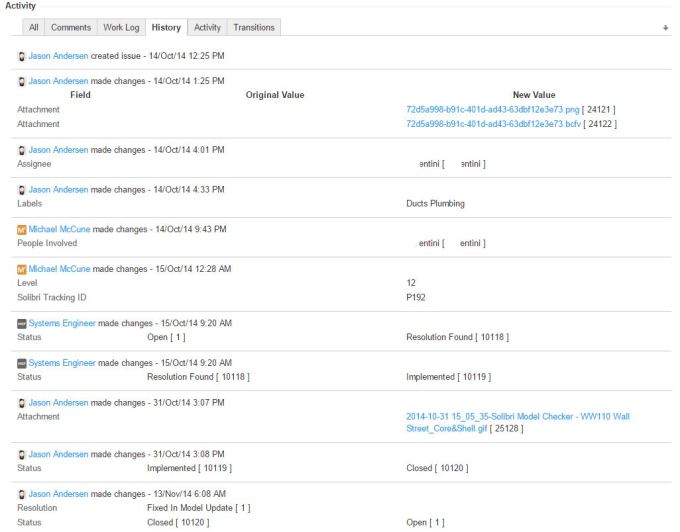
As issues change status and get reassigned, we can review the history of that issue. We can even see how long it spent in a specific status or in a person’s court.
Conclusion
For CASE, this workflow using Jira isn’t about the charts or cool customized tools. We use Jira on all coordination projects because it standardizes and centralizes the information while making it accessible and editable by everyone on the project. During coordination meetings, Jira becomes the agenda of issues to discuss, the meeting minutes, and the close out documents/report for the team when the project comes to an end. We continue to adapt and improve the process as new technologies surface and as existing industry tools improve. The workflows and tools that we have designed are what make this process efficient.
For the AECO industry, this workflow opens up opportunities to capture, maintain, and track valuable building information. By breaking our dependence on the workflows of AECO industry software and demanding interoperability and APIs, we can benefit so much more. We can make it fit how we work. We can change it when the project changes. More importantly, we own the data and process. This workflow is not meant to downgrade AECO industry software. It just highlights that modeling software like Revit and Archicad is great at modeling, not issue tracking. Analysis software like Navisworks and Solibri is good at analysis, not issue tracking. Document markup software like Plangrid and Bluebeam is good at markups, not issue tracking. Will a single piece of software ever be good at it all? Man I hope so. I hope that in a basement somewhere there is a 12 year old creating a cloud based modeler that does all this and more. If you are that 12 year old you belong at CASE, not middle school. 🙂
As you could tell, it took a while to get this one out. The delay was mainly due to me moving from NYC to Florida and having a baby girl!
